Iron Line Variability in DiscoSeismic Corrugation Mdoes
X-ray emissions from accretion disks around black holes are modulated by low frequency, quasi periodic oscillations (QPOs). The origin of these oscillations is not yet understood. For a SURF project in the summer of 2012, I worked with David Tsang to investigate whether these QPOs could be explained by vertical discoseismic oscillations in the inner region of the accretion disk. For more detail, take a look at the paper!

Figure 1: The corrugation modes with radial nodes n = 0, 1, 2 for accretion disks around black holes with spin a/M = 0.001, 0.01, 0.1, 0.5, 0.9 .
Corrugation Modes
Corrugation modes are natural oscillation modes of accretion disks trapped between the innermost stable orbit (rISCO) and the inner vertical resonance radius (rIVR), which strongly modify the inner structure of the disk (see Figure 1). With higher black hole spin, the propagation region of the modes is greatly reduced, and its resulting signal is harder to detect.
Ray Tracing
As a photon escapes the gas of an accretion disk, its path is influenced by gravitational bending of light rays, gravitational redshift, and the relativistic Doppler effect before it reaches the observer. Since this is a time reversible process, we employ a technique called raytracing, which follows the trajectory of a photon from the observer to the accretion disk. We assume the accretion disk to be in a Keplerian orbit around the black hole. Therefore, the gas moving away from the observer will be redshifted, and likewise the gas moving towards the observer will appear blueshifted. This phenomenon is captured in Figure 2.
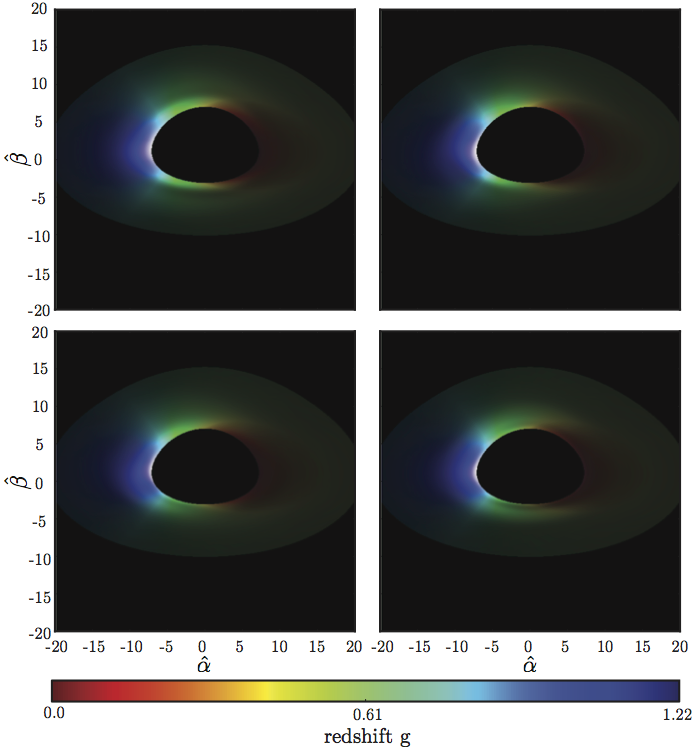
Figure 2: An example of corrugation modes in accretion disk images as a function of the phase of the perturbation. Moving clockwise from the top left corner, the oscillation phase increases by π/2. The color represents the redshift, while the brightness represents the intensity. This is a representation of an accretion disk for a black hole with spin a/M = 0.001, μo = 0.5, and an arbitrarily chosen r=20M. These images were created assuming a limb brightening law, f(μem) = log(1 + 1/μem), for the angular emissivity.

Figure 3: The first row shows the unperturbed broadened line spectra. The remaining rows show the spectral variation (the difference in intensity from the average spectra) as a function of oscillation phase and observed frequency ratio for the precession of a tilted disc, and the n = 0, n = 1, and n = 2 corrugation modes. Here we assume limb darkening angular emissivity for a black hole with spin a = 0.01 and inclinations µo = cos θ = 0.1, 0.5, and 0.7.
Fe Kα emission profiles
Iron K-alpha emission lines (the result of an electron transitioning from the innermost shell to the 2p orbital) are a powerful tool for probing the inner structure of the disk. X-ray fluorescence creates a particularly sharp emission profile, while Doppler boosting and gravitational redshift cause a spread and a bimodal nature of this emission profile. Understanding the dependency of the Kα emission spectrum on the phase of the QPO gives testable predictions of its origins.
Using raytracing, we can predict the distortion in the Fe Kα emission profile due to different corrugation modes and spin parameters. For example, in Figure 3, we explore the observable phase-dependent signal of a QPO in the accretion disk of a black hole with spin a = 0.01 for different corrugation modes and inclination angles.